

GD&T Tools Prevent Methods Divergence in Medical Device Manufacturing
Appears in Print as: 'Methods Convergence GD&T Tools'
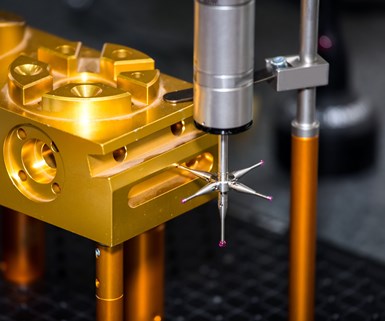
Evaluation software that simulates the physical locators of a machine tool when establishing datums ensures that medical device manufacturers accurately inspect parts.
Share
Parts that are within tolerance when measured manually can be found to be out of tolerance when measured on a CMM due to GD&T methods convergence.
Design standards such as ASME Y.14.5 provide a universal language for designers, machinists and inspectors to communicate. Virtually any part designed to the standard can be manufactured and inspected per print with no need for interpretation of the design intent. Geometric dimensioning and tolerancing (GD&T) conventions facilitate this communication by making clear exactly when, where and by how much each dimension is allowed to vary, with particular emphasis on allowances for material to material mating surfaces.
Featured Content


More important, GD&T conventions provide practical and actionable means of controlling complex curves, shapes and forms, such as those found in medical devices that must mimic parts of the human body.
In short, GD&T provides all that tools designers need to make perfect medical device parts, and yet GD&T is still not the universal convention in precision machining, and particularly for medical devices. Why? To understand the practical issues in implementing GD&T in manufacturing, we can look at where GD&T first took root—in aeronautical and aerospace components manufacturing.
Aerospace components are designed to meet many, often conflicting, requirements. Weight, strength, drag, thrust, cost and lifetime all revolve in an endless optimization. Designs using GD&T have become a practical necessity to manage the complexity of the tens of thousands of parts that make up aerospace systems.
Likewise, implantable medical components also must accommodate many tradeoffs and nuances in design to ensure proper fit and function.
As the makers of CAD design software have integrated powerful GD&T functionality into their programs, dimensioning and tolerancing of complex part designs has become easier. Today, a single profile tolerance call-out can replace an entire table full of dimensions and tolerances, each dependent on the material condition of one or more datums.
Yet as the part drawings have become simpler, the dimensional analysis required to determine conformance with the design requirements under GD&T has actually gone up. The machinists and inspectors who make and measure these parts need equally powerful tools to confirm the design intent so easily conveyed by the CAD software.
Methods Divergence in GD&T
Almost every precision manufacturer has experienced the following scenario:
A master machinist with 20+ years experience finishes making a part on a multi-million dollar CNC machine tool. The inspection technician measures the part on the CMM and says, “It’s out of spec.” The machinist knows this must be a mistake so he manually inspects the part on a surface plate using a combination of gage blocks, height gages, right angle knees and other simple tools. The part measures in spec on the surface plate, which in turn, makes the CMM’s “calibration” suspect. After a thorough calibration, the CMM still measures the part out of spec.
How does one account for the differences between a high precision, automated machine tool, a precision CMM, and simple, well-proven hard-gaging techniques—techniques that the Y.14.5 standard is intended to reflect?
The answer lies in the different ways the CMM software and the machine tool establish datum planes and features. The surface plate fits the plane of the part to three seating points, which closely mimic the way the part was fixtured on the machine tool’s table. The CMM constructs a plane using “least squares,” “best fit” or other means from the points measured on the seating surface. Which method is correct?
Fair to say, both methods are correct—up to a point. The important question, though, is which method best confirms the design intent?
The accuracy of the data points gathered by the CMM is rarely in dispute, but the way those data points are fitted to a plane, and in turn, used as a datum reference, are very likely to be different from the way the layout inspector would do it. So it is not the measurements themselves that cause the discrepancy, but rather the analysis of the measurements compared with the design where the gap occurs.
Imagine this same situation in a global medical device maker with multiple suppliers around the world, each with their own manufacturing processes and inspection techniques. One can only imagine the number of good parts that have been rejected or the number of hours spent trying to recalibrate processes that were never out of spec in the first place because manufacturers lacked the tools to properly and easily evaluate parts to their design intent. Even worse, consider the possibility that non-conforming parts were passed because of metrological errors.
If all this sounds familiar, that’s because the situation repeats itself many times daily in machine shops around the world. And all too often, the lament from the manufacturing engineer is “I wish we’d never started using GD&T in the first place!” As the difficulty of correlating data from multiple suppliers and processes increases, the more difficult it becomes for medical device makers to enjoy the benefits of GD&T.
Using GD&T Tools to Prevent Methods Divergence
Just as ASME Y.14.5 GD&T is a common language for designers, there is a common language tool for analysis of measured data. Imagine a tool that can evaluate measured datapoints from the CMM or any source in ways that conform exactly to the ASME Y.14.5 standards.
Well, such tools do exist, though they are not common. One such tool is SmartProfile software by Kotem. SmartProfile is a blend of CAD engine, data fitting and dimensional analysis software that can evaluate data from any source and compare it with a CAD model in accordance with the ASME Y.14.5 standards.
SmartProfile bridges that gap between CMM software capability and the GD&T standards. Using such a tool ensures the analysis is reliable, regardless of the source of the data points. Thus, data from multiple suppliers or processes can be compared on an “apples to apples” basis to ensure parts are in compliance or to show where opportunities for process improvements exist.
An Example of GD&T Methods Divergence
Let’s look at an example where methods diverge and how we can bring the result back on track using better tools.
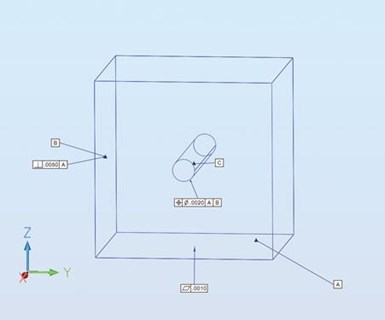
Figure 1. Geometric dimensioning and tolerancing (GD&T) is applied to a simple machined part.
Figure 1 shows a simple cube with a hole bored through the center of one face. The centerline of this hole is required to be located within a cylindrical tolerance zone having a diameter of 0.002 inch, located from Datums A and B.
As in the scenario above, the hole is bored on a precision machine tool and then checked using an equally precise CMM. The CMM software establishes Datum A by taking a number of points on the surface and constructing a plane through those points using the common least squares method.
With the datum established, the CMM measures the hole position and reports
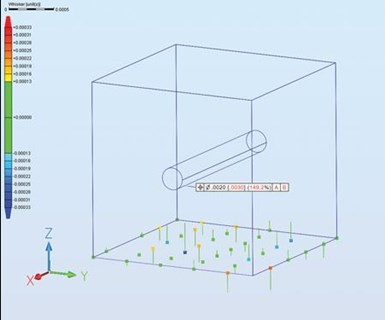
Figure 2. Datum A is established using a Least Squares method. The feature tolerance is exceeded.
the hole as being out of tolerance (Figure 2). However, a traditional manual layout inspection shows the part to be well within tolerance. How can this be?
Analysis software can help us understand the situation. Look again at Figure 2. Note that a number of the whiskers on points measured on Datum surface A point downward. This indicates that these points lie beneath the constructed plane. This is a typical Least Squares result. Least Squares establishes the datum plane such that the points lie on both sides of the datum, a physical impossibility when the part is set up on a machine tool table or surface plate.

Figure 3 shows the datum plane established using the ASME Y.14.5 method for establishing a planar datum in SmartProfile software. This method positions the points measured on Datum surface A relative to the theoretical Datum plane.
When the through-hole is measured based on this correct datum reference frame, the centerline of the hole now falls within the tolerance zone. This result is in agreement with our expectations for the precision tool the part was made on, and agrees with the result obtained by layout inspection.
Looking closely at the points that form the plane, the reason for this becomes obvious. Notice that the part is now contacting the datum plane at the three high points (shown in yellow) and all other points are above the datum plane (the whiskers all point upwards). The software has simulated the contact between the cube and the physical machine table or surface plate. This raises the cube up (as it was on the machine tool) and now the centerline of the hole falls within the tolerance zone.
The amount of difference between Least Squares datum fitting and the functional fitting as defined by ASME Y.14.5 in this example is a function of the flatness of the actual datum feature. If Datum surface A were perfectly flat, all methods provide the same hole center location. However, such perfection is rare.
A simple solution would be if designers could force manufacturing to produce perfectly flat planes for the datum features. But, doing so would add unnecessary time and cost to the process and would be unacceptable. A better solution is to leave the flatness tolerance as the designer specified and use GD&T evaluation software that properly simulates the contact between the part and a datum simulator such as a machine table or surface plate.
Some have proposed to shift the Least Squares result so that it rests on the
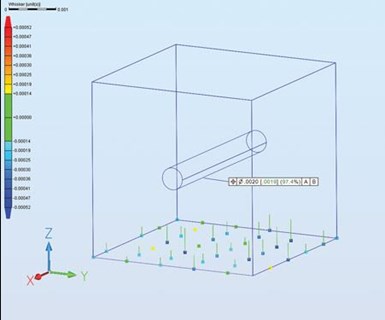
Figure 4. Datum A is established using a Translated Least Squares method. This technique also produces an incorrect out of tolerance result.
highest point of the datum feature in an attempt to salvage Least Squares as a solution to the problem. Figure 4 shows the fallacy of this approach. When the part is analyzed using the Translated (shifted) Least Squares algorithm, all points do lie above the imaginary surface plate, but notice that the part is somehow balanced on one corner (in the single yellow point) with the rest of the part “floating” in air. This does not match what will happen in the real world. And, even with this attempt, we see that the result still rejects what we know to be a good part.
Visually Reporting GD&T Results
The aphorism “A picture is worth a thousand words” is equally true when it comes to geometric dimensioning and tolerancing. One of the greatest challenges of integrating measurement data and GD&T analysis into a process control loop is understanding where and how the tolerances are being consumed. This is best done visually, since the machinist’s logical question if confronted with an out of tolerance condition is “how much and which way?”
Using SmartProfile, we see a graphical output that clearly shows the percentage of tolerance used in each case, and the direction of deviation of the measured data.
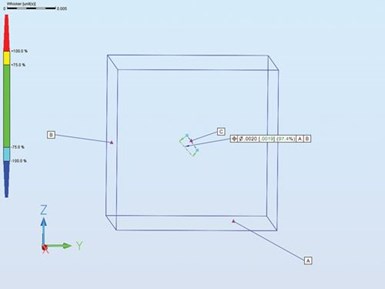
Figure 5. Graphical output from SmartProfile shows the direction and magnitude of the actual vs. nominal feature characteristics.
Figure 5 shows the nominal and actual measured centerline positions of the hole. Notice the actual centerline is offset down and to the left compared with the designed nominal centerline. This information could be used to make an effective process adjustment. Current best practice would be to measure several parts and make the adjustment based on the mean or average value so as to “factor out” the process repeatability.
It is important to note that had the centerline of the hole been mislocated above the nominal, the Least Squares method would have allowed the part to “sink” into the surface of the imaginary table or surface plate and therefore showed a non-conforming part to be in spec. Undetected, this error could have dire consequences if the part were implanted in a human body.
Organic Parts Need GD&T
One segment of the medical device industry that is beginning to make good use of GD&T are the orthopedic implant makers. These organic parts, such as knee and hip implants, embody forms and shapes found in nature. They are almost impossible to make or measure using traditional plus/minus tolerancing. A CAD model with GD&T tolerances (such as Surface Profile) is the best way for the designer to specify the design requirements. Evaluating these profile tolerances using layout techniques is difficult and time consuming at best and impossible in many cases. To properly measure these parts and provide useful process control feedback to the machinist, a high quality measuring system and powerful analysis software capable of properly establishing datums and applying geometric tolerances is needed.
The Bottom Line: Avoiding Methods Divergence
To make effective use of geometric dimensioning and tolerancing—indeed to comply with the requirements of ASME Y.14.5—it is critical that the manufacturing and evaluation processes agree on what it means to establish a datum. Manufacturing processes, especially machine tools, use physical locators. The evaluation software needs to simulate these locators when the datums are established. If this is not done, the resulting methods divergence will generate rejections of conforming parts and acceptance of non-conforming parts. Difficulties at assembly, excessive material review costs and even warranty or liability costs may all find their origins in methods divergence.
RELATED CONTENT
-
Setup Options for Swiss Automatic Lathes
A hydraulic chuck and a counter-balanced centering tool, originally developed as in-house solutions, are now available to address the limited working space that is common in Swiss machining.
-
Determine Passivation of Stainless
Properly cleaned stainless steel is naturally protected from corrosion by a thin, passive film. But this passive layer can be removed or scratched. A passivation meter measures the surface potential under controlled conditions.
-
Keeping Watch on Small Parts
From watch parts to exotic medical applications, this shop takes on the world of micromachining.
