Statistical Process Control Goes Visual
In the world of manufacturing, there is a perception that Statistical Process Control (SPC) software is beneficial only to OEMs and large Tier 1 suppliers.
In the world of manufacturing, there is a perception that Statistical Process Control (SPC) software is beneficial only to OEMs and large Tier 1 suppliers. But in fact, SPC can play a critical role in small and mid-size manufacturing businesses. Smaller manufacturers are constantly tasked to stay competitive with fewer resources while they compete for business in the U.S. and with foreign companies with lower labor costs. In high volume production machining environments, SPC software provides operators, engineers and managers with sophisticated tools for investigating manufacturing problems, performing root cause analysis, and pursuing process improvement initiatives.
Wilcox Associates, a Hexagon Metrology company, recently released its DataPage+ product as a complement to its PC-DMIS inspection/measurement software. This SPC software allows a company to collect all of its measurement data into a non-proprietary Microsoft SQL database, and then communicate those statistics in a highly visual format. This capability minimizes manual data entry and the often lengthy calculation process to generate decision making information during the build process. For high volume manufacturers, quicker problem resolution translates to a shorter time to market for products.
Featured Content
Measurement data is traditionally scattered throughout a manufacturing plant. Quality data is gathered using a variety of standard metrology devices such as CMMs, laser trackers, articulating arms, vision systems, theodolites, calipers, height gages, and so on. Each system outputs coordinate data in different formats, and often these data are not linked together at all. With the implementation of a SQL database, large volumes of information gathered from various devices can be incorporated into a centralized depository. With all measurement data in one database, the SPC software user can easily migrate and manage data, perform correlation studies, and customize output formats to satisfy many manufacturing applications.
Monitoring Key Characteristics
For quality control in production machining, components are sampled frequently and over a period of time to track part characteristics and tolerance analysis. Using SPC software, a baseline process can be developed as data can be gathered on the fly, aggregated and analyzed to plot the trend. Measurement data sets from several sample runs can be compared for average deviation. Data sets from different devices used to measure the same part can also be merged and compared.
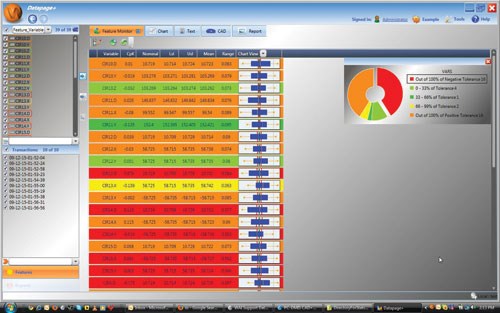
Another advantage of the SPC software is the ability to observe parts being measured in real-time during a production cycle. From the comfort of a computer in the office or on the shop floor, an engineer or quality specialist can monitor, verify and chart part quality as quality measurement data is captured. A customizable “dashboard” type screen is used to check key features along with important statistical values such as CPK (ability of a process to produce output within control limits and client specifications) to track the continual variation throughout the manufacturing process. The user can also program the software to refresh the data at different time intervals. A color-coded chart system signals the user if a deviation occurs, so investigative or corrective action can take place immediately.
Statistical Reporting
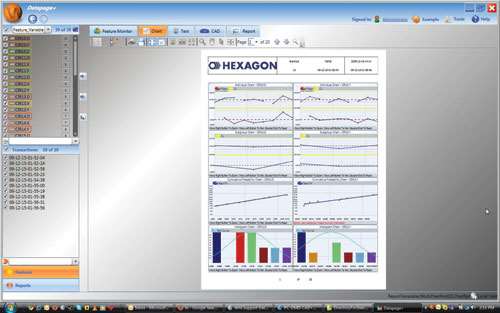
In a manufacturing facility, several people or departments may need real-time measurement information for troubleshooting and resolving production issues quickly. With that in mind, an SPC report is only useful when it is quick to read and easy to understand. Datapage+ has integrated advancements in the area of visual reporting of statistical data. The software provides functionality to generate statistical plots such as run charts, histograms and textual reports—all can be customized via a template builder to create desirable layouts. Several statistical plots can be arranged on a single page.
Once the user sets up a report, the software automatically takes its information from the PC-DMIS database, which eliminates all manual data entry—a laborious bottleneck for any quality assurance department.
CAD Integration Reports and Presentations
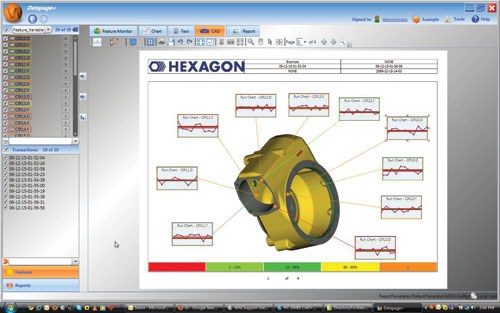
A significant enhancement in reporting is the software’s ability to combine a graphical representation along with key characteristic values, charts and labels pointing to the exact location on a CAD model.
CAD reporting can save a substantial amount of time explaining part specifications and quality issues. When creating reports, the user can zoom, rotate and annotate a CAD model in any view to show the area or areas of interest. The system routes label leader lines between the part model and the measurement information. Label content can be tailored using the custom label editor to display charts, statistical values, or simple range value. Statistical characteristics “over time” can also be annotated to the CAD model.
Reports generated on any given day can be saved and stored for future use. Process and statistical reports can be opened and continually updated with new measurement data gathered at a later point in time—a capability well suited for a high volume production environment. Reports can be exported in several popular data formats.
Datapage+ includes a toolset needed to create comprehensive visual presentations merging all types of visual and textual statistical information. Once reports are created in different layouts, the page order can be rearranged to produce a final presentation for immediate or future consumption. Presentations can also be distributed in many formats such as PDF and XPS, and then distributed to others via e-mail.
Not a Tool for Big Enterprises Only
SPC opens the door to a broader way of thinking and implementing quality control initiatives. SPC software provides an integrated system that can capture and automate measurements from multiple metrology devices into actionable, easy-to-understand formats for distribution and analysis. The benefits are threefold: quick problem resolution, reduction of production downtime, and the overall improvement of in-depth analysis on the build process and the issues that arise. From a business viewpoint, quality parts and a reputation for precision is simply money in the bank.
RELATED CONTENT
-
The Five Reasons ERP Software Needs To Provide a Nesting Interface
Nesting software provides a measurable improvement over the old manual process for ERP software.
-
A Shop Snapshot(s) in Time
Shamrock Precision has made significant strides to diversify its customer base and implement various process improvements, applying a crawl, walk, run approach to adding new technology such as ERP and automation.
-
Use Your Machine Shop Management System as a Sales Tool
Why not leverage an effective shop management system for your sales/marketing advantage in today’s competitive market?


