Executive Dashboard Helps Drive the Business
Doing more with less is the order of the day. Quickly understanding how a business is doing on a daily (even hourly) basis is key to decision making.
A number of ERP (enterprise resource planning) programs are available for shops to help them manage their day-to-day business operations. They often offer a variety of capabilities including estimating, managing sales orders, shop orders, job costing, time tracking, job scheduling, inventory control, purchasing, receiving, shipping, invoicing and other general accounting functions. Thus, they are very good at managing the details of running a manufacturing business.
Today, many executives do not have the time to sift through the details in order to quickly grasp the state of their business at any given time. Even though all the transaction data is there, they simply want things organized into a format that is comfortable for them to quickly absorb.
When they cannot get what they want quickly, they can become very frustrated. This often leads them to ask their staff to design and build custom summarized reports, excel spreadsheets and trend graphs so the information can be provided to them in a more concise way. While this may provide the executive with what he or she is looking for, it may add unnecessary work to the staff’s already busy schedule.
Therefore, not being able to access information as quickly as one would like can actually cost business owners money. It is more critical than ever for owners to identify problems quickly, recognize trends and deal with them before they become bigger problems.
Fingertip Intelligence
Whether it is the receivables list getting longer than desirable or back orders stacking up or an estimated annual usage not hitting the projected mark, an executive needs to be able to turn this raw data into true business intelligence.
That’s where an executive dashboard comes into play. The concept of an executive dashboard is to provide the officers of a company with a pleasing graphical interface that organizes and presents information in a format that is easy to use. The data from the executive dashboard can even be configured to provide pre-summarized trending data based on the user’s needs and timed to provide the information based on a specific schedule (for example, by day, week, month or year).
At Henning, what has really got us excited about creating our new executive dashboard is that by using Microsoft’s latest .NET development tools, we can now prepare and present data in innovative, graphically engaging ways that were not even possible using older development technologies. Included in these development tools is the ability to create vector-based graphics for windows, data grids, graphical gages and trending graphs.
This means that everything on the screen is fully scalable. At a time when monitors are getting larger, this is critically important and allows for charts and graphs, and so on to fill and scale to the screen size. Data not only looks better; it is also much easier to read.
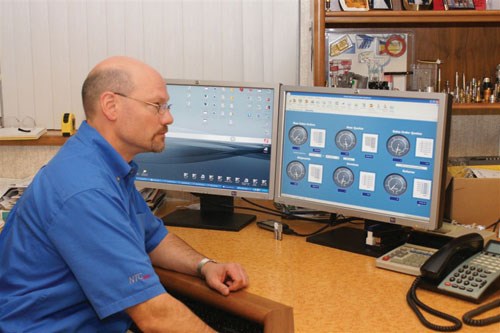
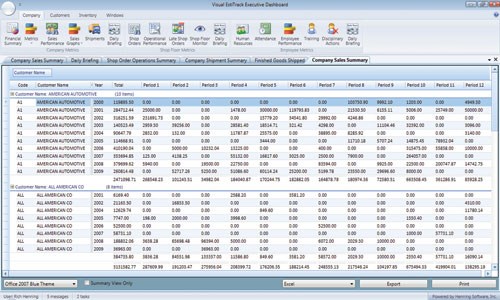
All reports are presented in a rich, data-grid format. Using this technology, data can easily be manipulated, filtered and saved out to an Excel or CSV file for further analysis. Important metrics can be presented in a gage format (see photo on page 31) to present the data in an easy-to-grasp, snapshot view.
Like a Car’s Dash
We believe that using gages to depict critical metric information provides an effective metaphor for instantly showing the executive where he or she stands at any given time, just as the gages in a car alert the driver to what is functioning properly and what is not. For instance, the executive can even set up color-coded sections within the gage, which would tell whether a given reading is in an acceptable range (green) or whether there is need for concern (red) about any critical metric that is being monitored.
All data in the executive dashboard is intentionally set to “read only” so that valuable information is not inadvertently changed or deleted by a slip of the finger. But that does not mean that the data cannot be further filtered, sorted, grouped and manipulated. By placing the data into powerful data grids, the user can massage the data into the format they wish, and if they choose, they can export it to Excel or print out the customized view to a report.
Talk to Me
Another tool available in some executive dashboard products is a verbal daily briefing. Why verbal? Today’s shop executive may get into the shop at 7:30 a.m. carrying his third cup of coffee. After doing a quick walk through the shop, he glances at the Wall Street Journal sitting on his desk, flips through an article, but still wants to prepare for the 8:15 a.m. production meeting. While doing all of this, the executive could ask the executive dashboard to provide a verbal daily briefing on the key business metrics being monitored and can simply listen to them while multitasking through all the other duties.
This verbal briefing can be set to deliver whatever data the busy executive feels is most important. For instance, the customer may choose to set a verbal daily briefing for overall company metrics such as what is in receivables, payables or the company’s current bank balance. It may state how many orders shipped yesterday and what the invoice amount of the shipments was. It could tell them how many jobs are not shipping on time, verbally describe what is happening on the shop floor, or list the names of employees who arrived late.
A good flexible executive dashboard can pull upon all the detailed transactional data and provide almost any important business concern or metric the executive wishes to track and be informed about.
So in conclusion, while ERP systems are good at helping to manage day-to-day business activities, executive dashboards that sit on top of ERP data can be extremely useful in providing the “big picture” to executives who are interested in monitoring key business metrics and trends in an easy-to-use graphical user interface.
Related Content
The Gen Z Effect: Transforming Manufacturing Towards the Future
Discover how Gen Z is reshaping the manufacturing workforce with their values of flexibility, sustainability, technological advancement and inclusivity.
Read MoreRecognizing Signs of a Degrading Workplace Culture
Is your machine shop missing key “culture elements?” Here are ways to identify if your organization is heading in the right or wrong direction in terms of establishing a healthy company culture.
Read MoreReframing Work-Life Balance and Development Opportunities
Factors other than compensation can be the difference between keeping and losing a current or potential employee.
Read MoreJob Candidate Questions and What They Tell Us
Individuals who ask thoughtful, original questions in the interview set themselves apart.
Read MoreRead Next
Finding the Right Tools for a Turning Shop
Xcelicut is a startup shop that has grown thanks to the right machines, cutting tools, grants and other resources.
Read MoreHow To (Better) Make a Micrometer
How does an inspection equipment manufacturer organize its factory floor? Join us as we explore the continuous improvement strategies and culture shifts The L.S. Starrett Co. is implementing across the over 500,000 square feet of its Athol, Massachusetts, headquarters.
Read More


.jpg;width=860)
.jpg;width=860)


